PERMISSIONS Security level with Admin permission to configure Other Extensions & Tools. Refer to Admin security settings.
NAVIGATION Left Navigation Menu > Admin > Admin Categories > Extensions & Integrations > Other Extensions & Tools > API Activity by Hour
The API Activity by Hour page enables you to obtain hourly details about your SOAP and REST API activity at a per-integration level. The report shows you any instances where query activity exceeded request thresholds. You can also see what your integration vendors have been doing with the API. To open the page, use the path(s) in the Security and navigation section above.
Overview
Datto provides an API that is available to all customers. To deliver a high-quality and consistent experience across a diverse range of businesses and platforms, certain thresholds apply to all integrations.
The interactive API Activity by Hour report provides visibility into the usage statistics of your integrations. This information helps you create a complete picture of your API activity, including which of your applications are approaching or exceeding call thresholds, so that you can manage them effectively. For more information about API activity thresholds, refer to our REST and SOAP articles in the Autotask Developer Help.
There are three ways to view the information provided by the report. Select a topic to continue.
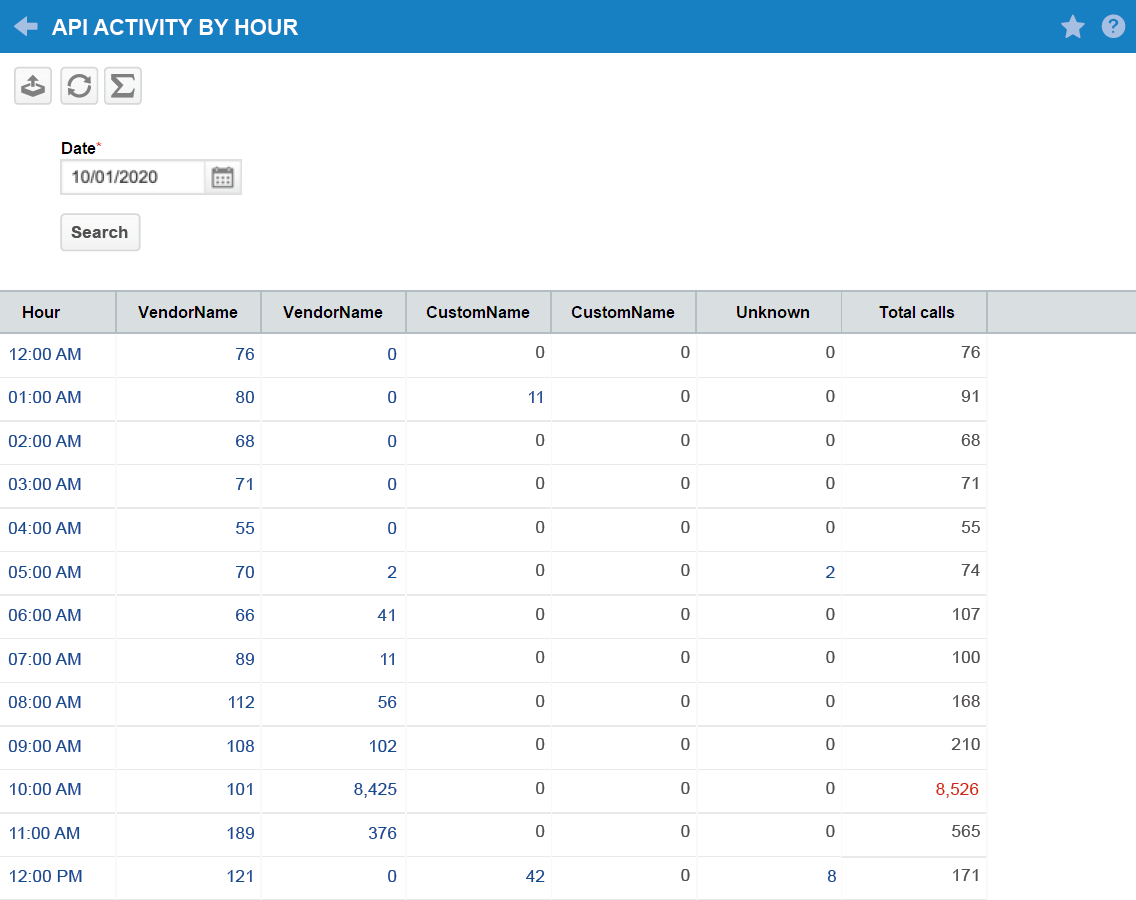
The summary table is the first page you'll see when you access the report. In this view, you'll see all API calls that have taken place within the selected 24-hour window, broken down by hour and by integration vendor.
| Icon or column name | Description |
|---|---|
|
Export |
Export the current table to a comma-separated values (CSV) file. |
|
Refresh |
Apply any applicable filters and refresh the current table. |
|
Sum |
Open the Totals table for the current report. |
|
|
View API activity for a selected date. Reports for the previous 30 calendar days are available. |
|
|
After selecting an activity date, click Search to refresh the current view with the updated report. |
| Hour | This column displays the 24-hour period for the selected date, beginning at 12:00 AM. The time appears in the format configured for your instance of Autotask. |
| VendorName | Each identified vendor will have its own column, in which all application activity for the vendor will aggregate. Integration vendors with no activity will not appear. |
| CustomName | If your integration has a tracking ID but no integration vendor defined, the application will have a dedicated column labeled with its internal name. |
|
Unknown |
Applications that do not have identifiable vendor or custom attributes will have their activity aggregated in the Unknown column. |
|
Total calls |
This column provides a per-hour sum of all API calls that took place for all listed categories. |
| Table cells |
The numbers in the table cells represent API request totals in your preferred number format. The Total calls column will display red numbers when any group of requests exceeds the hourly limit of 10,000 calls. You can click any cell that shows an hour or a count to see detailed API activity for that period. |
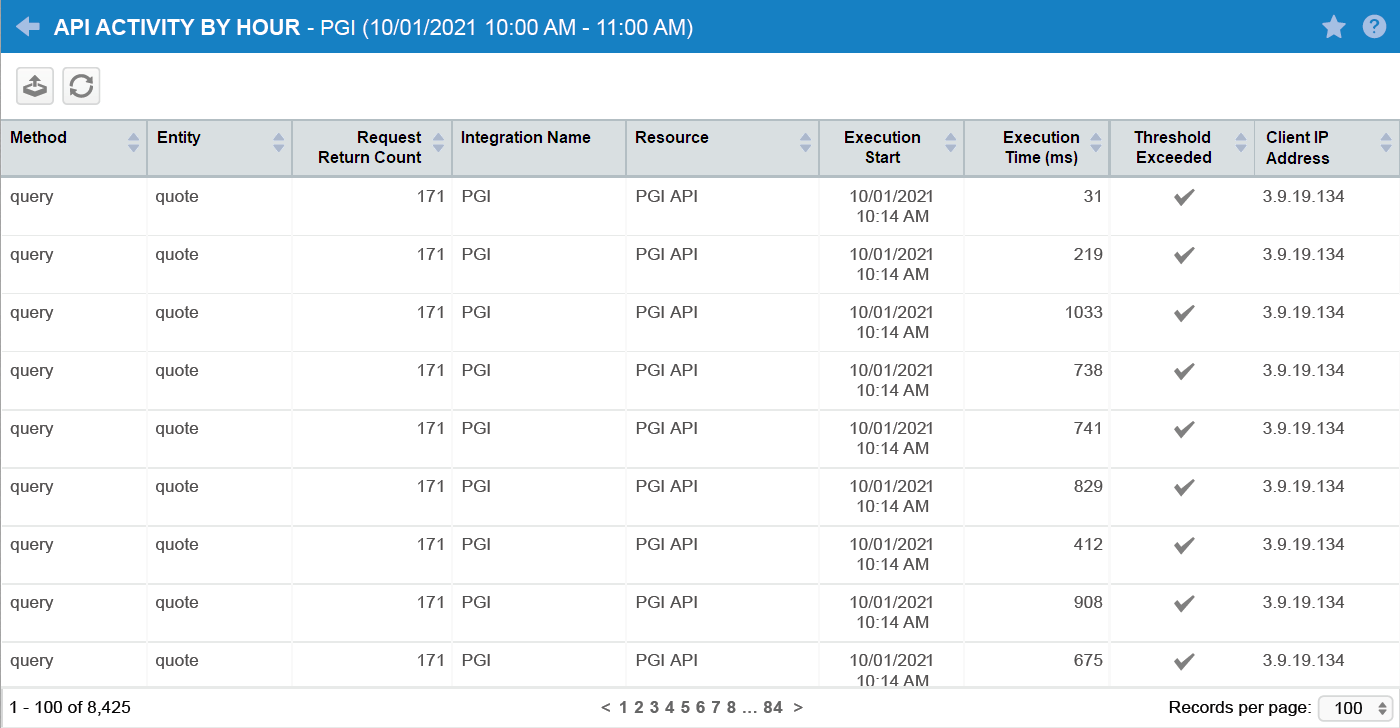
The Activity table itemizes API calls for the selected category and hour. To access this report, click any hour or number of calls under a vendor name in the Summary table.
| Icon or column name | Description |
|---|---|
|
Export |
Export the current table to a comma-separated values (CSV) file. |
|
Refresh |
Apply any applicable filters and refresh the current table. |
|
Method |
This value represents the type of action the selected application requested. Common methods are getUDFInfo, getFieldInfo, getEntityInfo, Create, Update, Query, Delete, GetAttachment, and CreateAttachment. |
| Entity | The name of the entity that received the request appears in this column. |
| Request Return Count | The total number of records returned by each call appears in the Request Return Count column. |
| Integration Name | If Autotask is able to detect the integration vendor's name, it will appear here. |
| Resource / API User | The Resource / API User column reports the name of the API user from whom the API call originated. |
|
Execution Start |
This value represents the time and date that the API received the request. |
|
Execution Time (ms) |
The Execution Time column records the time, in milliseconds, that the API spent executing the requested task. |
|
Threshold Exceeded |
A check mark in this column indicates that the activity by the integration exceeded the 10,000 calls per hour activity threshold. For more information about API activity thresholds, refer to our REST and SOAP articles in the Autotask Developer Help. |
|
Client IP Address |
This column records the origination IP address of the API request. |


